Is the Blue wall really so Blue?
Demographics that may give the Lib-Dems a hard on or blue balls
The Blue Wall has long been a term coined for the conservative stronghold in the South of England, being for generations tory through and through. In modern politics it is almost the complete opposite of the red wall. It has historically benefitted from Thatcher, it is wealthy, middle class, well educated, relatively young, pro-immigration and crucially anti- Brexit.
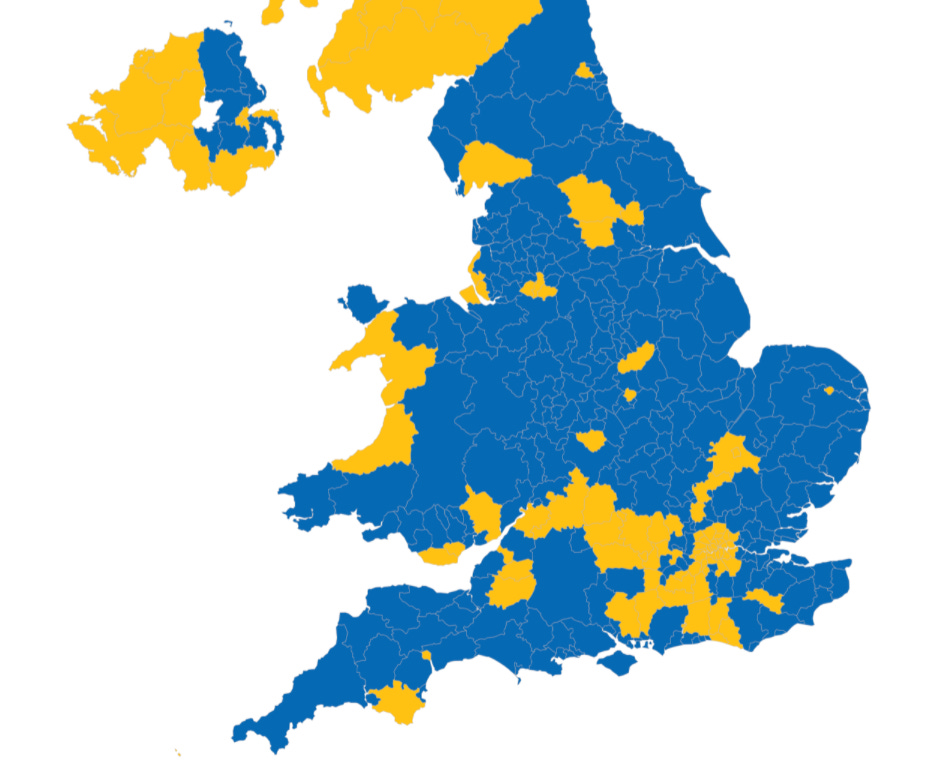
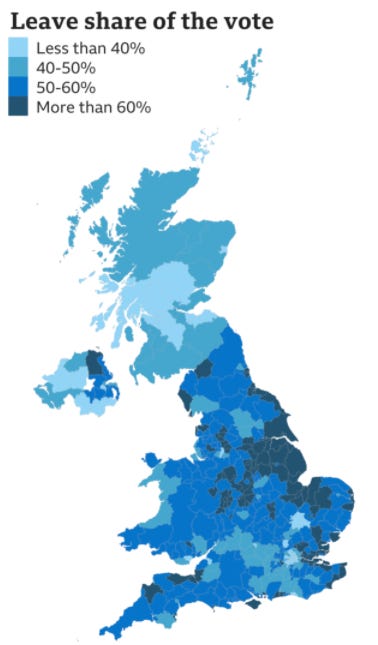
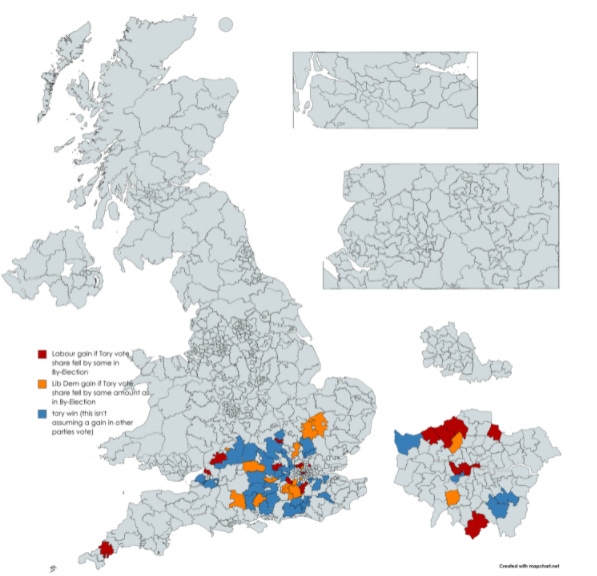
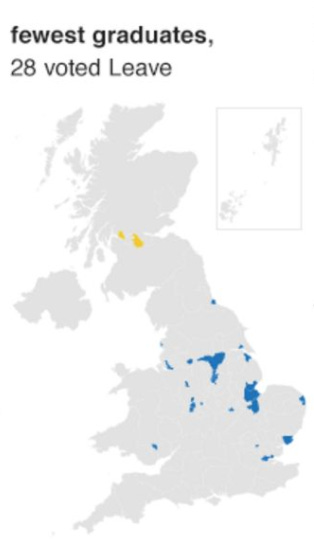
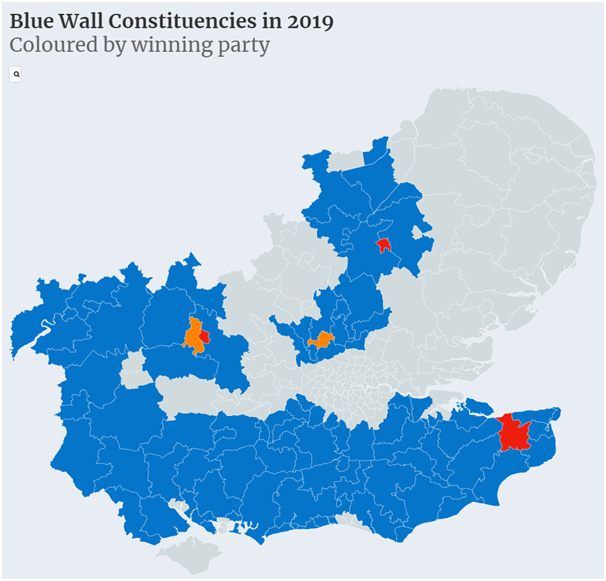
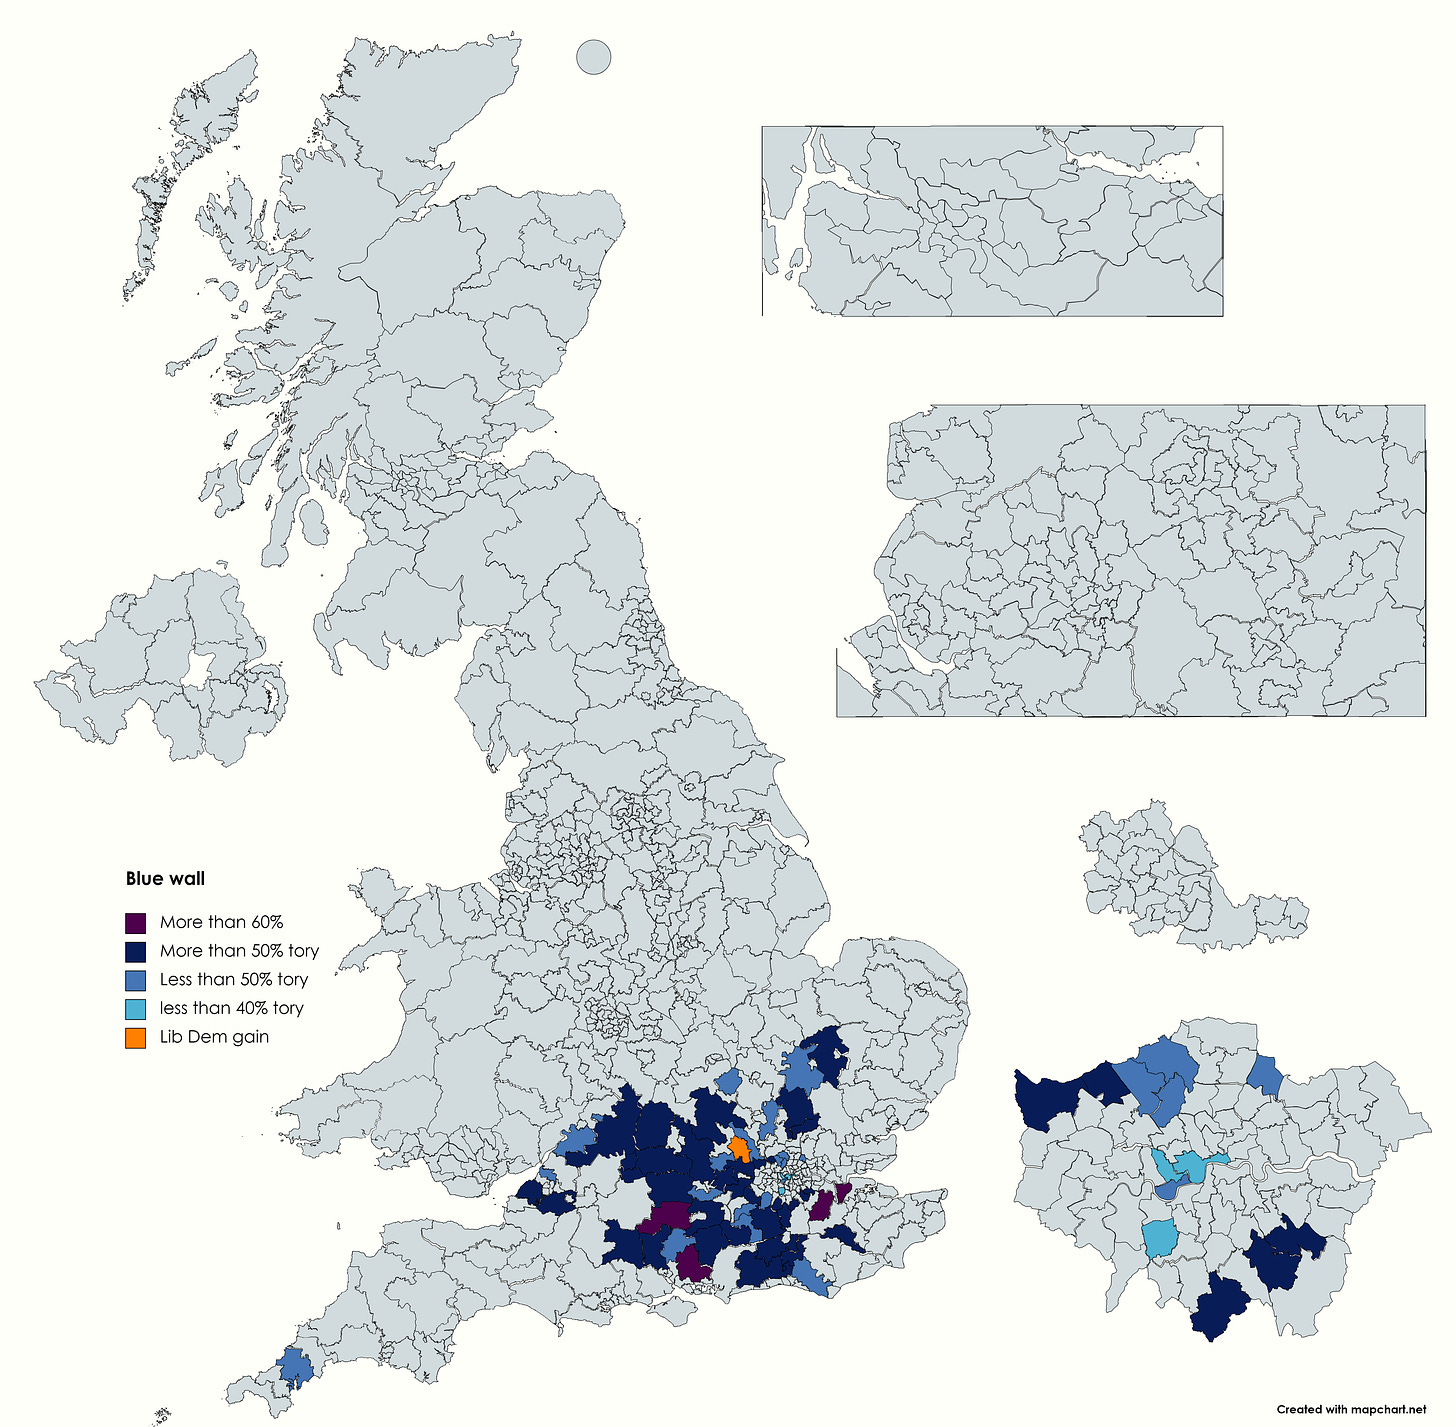
This map of the Blue wall seats along with the BBC list of all the areas that voted for Brexit shows just how strong the tory -remain link was in these seats, almost all of them were at the bottom of the list for support of Brexit. https://www.bbc.co.uk/news/uk-politics-36616028
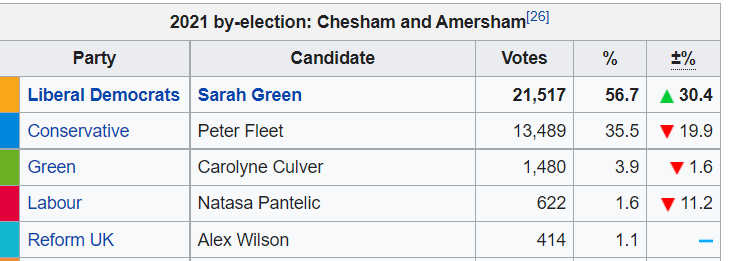
Although for many untouchable to the lib-Dems and Labour, even staying intact for most of the Blair years, in a shock by-election in Chesham and Amersham (Christ these lord of the rings names are a pain in the arse to spell), the Lib-Dems gained the seat for the first time in its history with a huge swing of 30.4%. Chesham and Amersham, much like how Hartlepool symbolized the red wall was the symbolic poster child of the Blue wall, having all the features of a typical Blue wall seat.
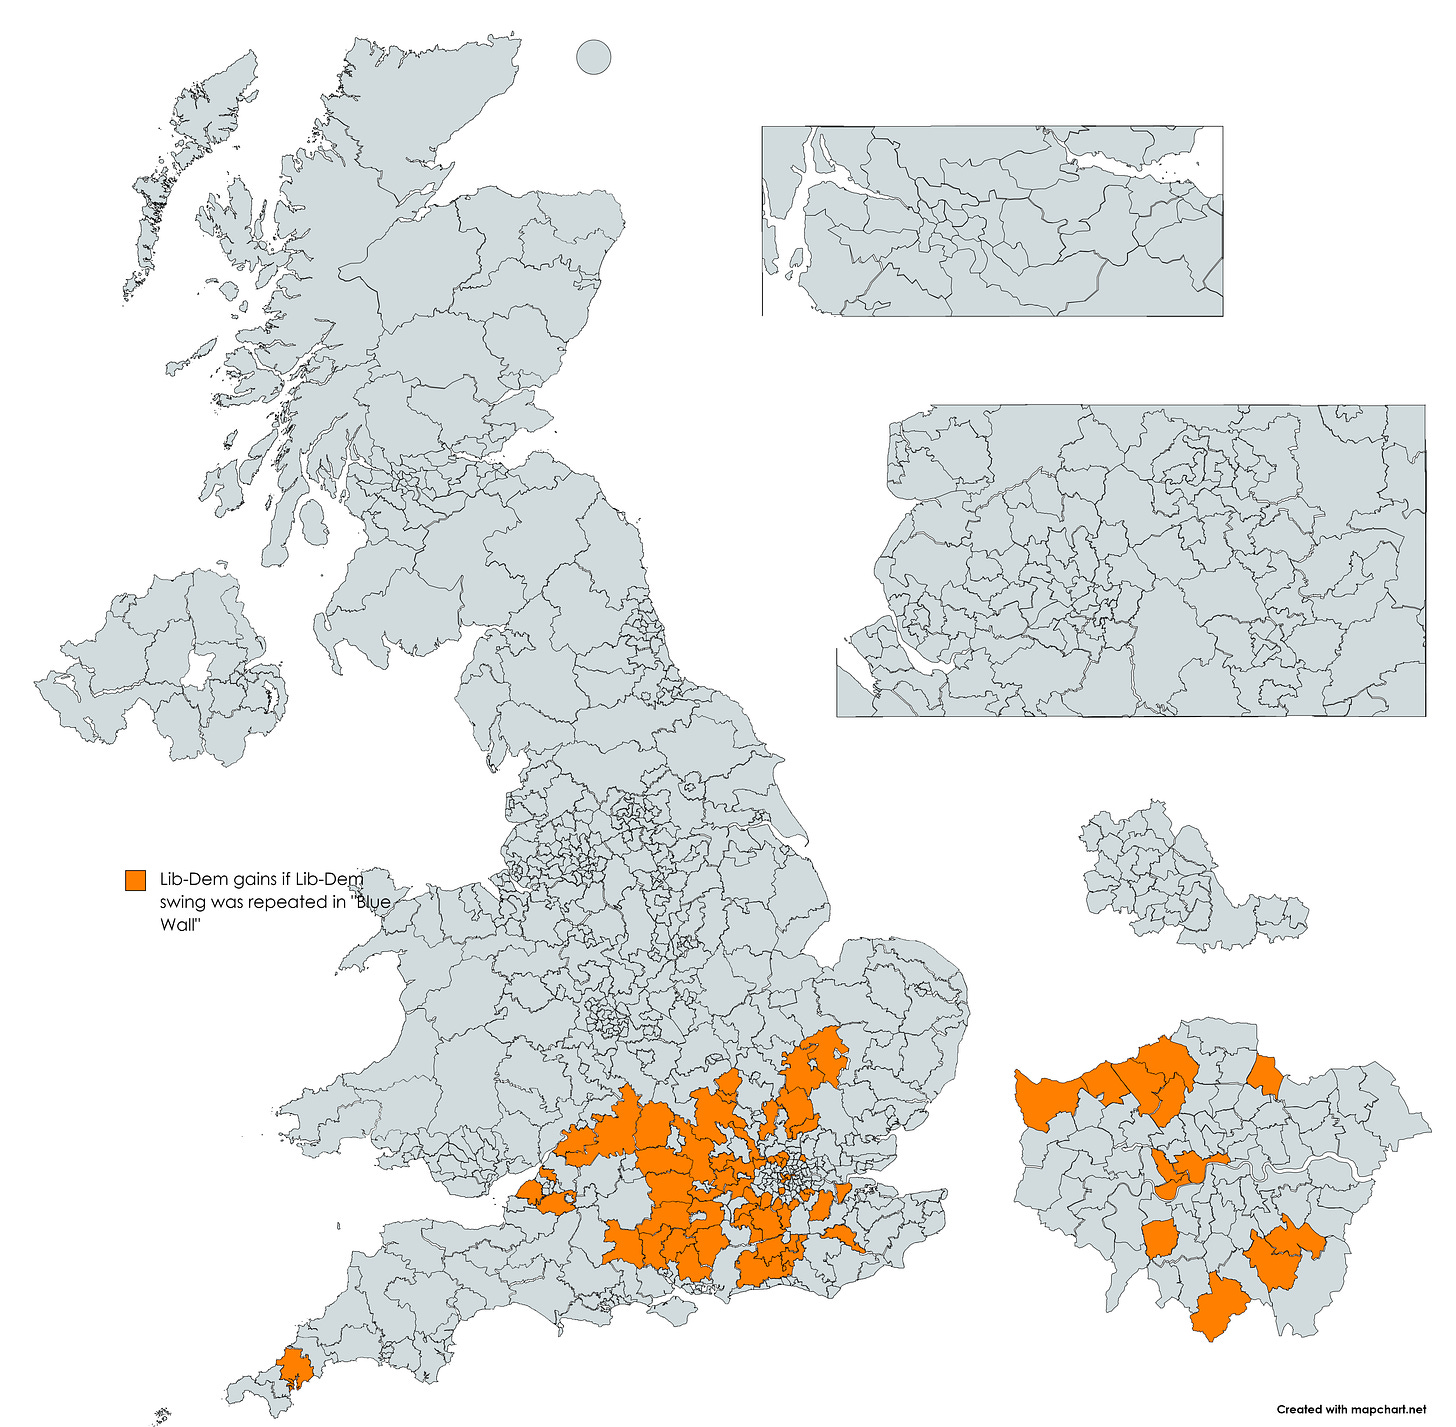
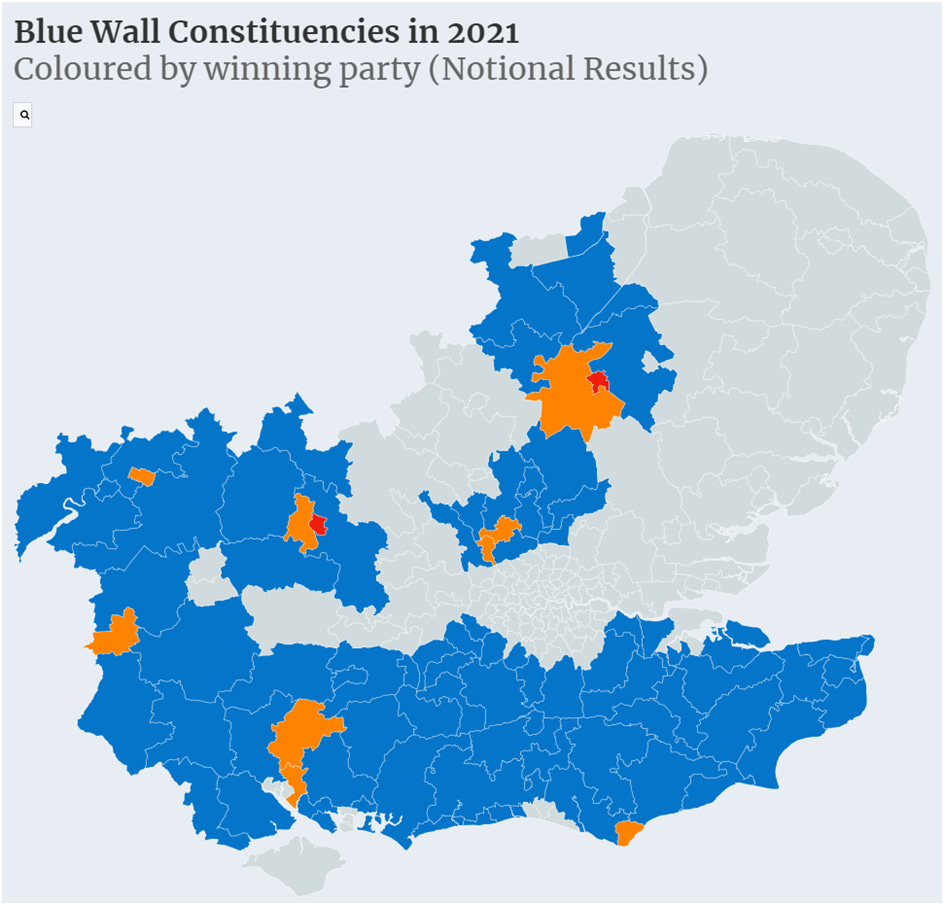
The size of the swing cannot be overstated, if the Lib-Dem vote swing was repeated across the Blue wall, the electoral map would look like this:
and if the fall in tory vote share was repeated across the Blue wall then the map would look like this
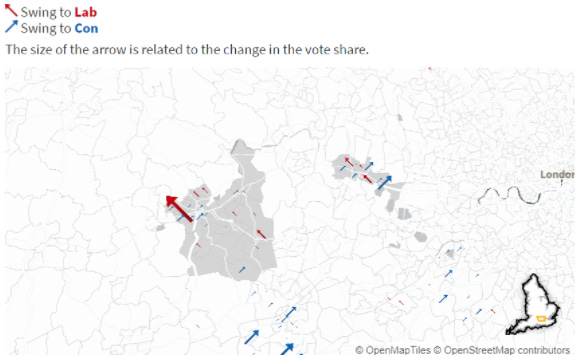
Although the by-election was the big wakeup call for many Tories, the Blue wall has been drifting away from the Tories for many years now. In 2019 and 2017 many saw a fall in their vote share for the Tories, including seats like Kensington which for 2 general elections in a row saw a fall in vote share (3.9 in 2019 and 10.1% in 2017). Other examples include Winchester, Clingford and Woodford Green, Wokingham, Witney, Sussex Mid and many more. (I would recommend checking out this link of red wall seats and checking out their voting history on the BBC and or Wikipedia https://docs.google.com/spreadsheets/d/1_n7iMas7vUMa60QsvcuwnsgU82mc6IRkERM8MGFMkhs/edit#gid=0 ).
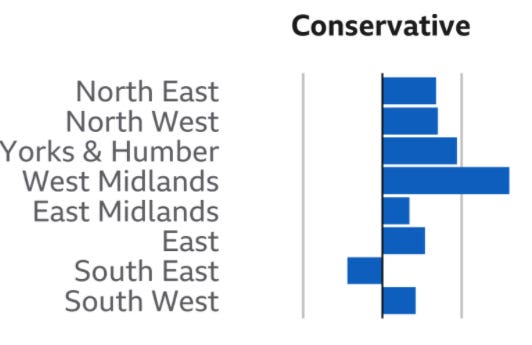
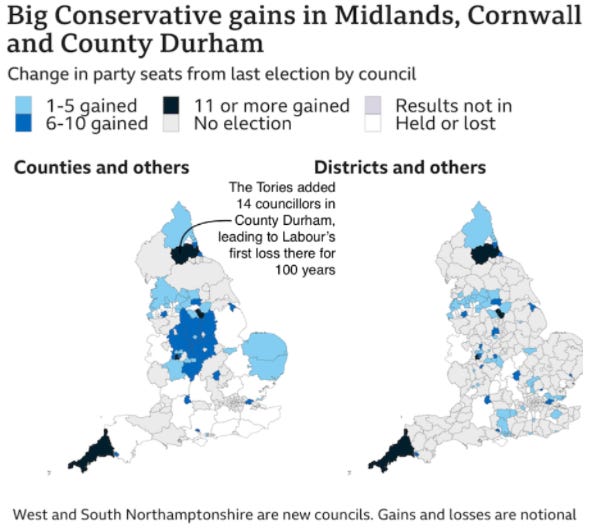
The council elections also revealed some more cracks forming in the Blue wall. Former tory heartlands showed signs of losses, in Hertfordshire, the party retained overall control but lost five seats including the council leader David Williams, this pattern was repeated in the Isle of weight. Other losses occurred in Sussex, Surrey and all over the South East.
The areas with the biggest losses for the Tories were in the Blue wall, and there is an undeniable trend away from them, demographic changes are likely the main factor at play.
Demographics
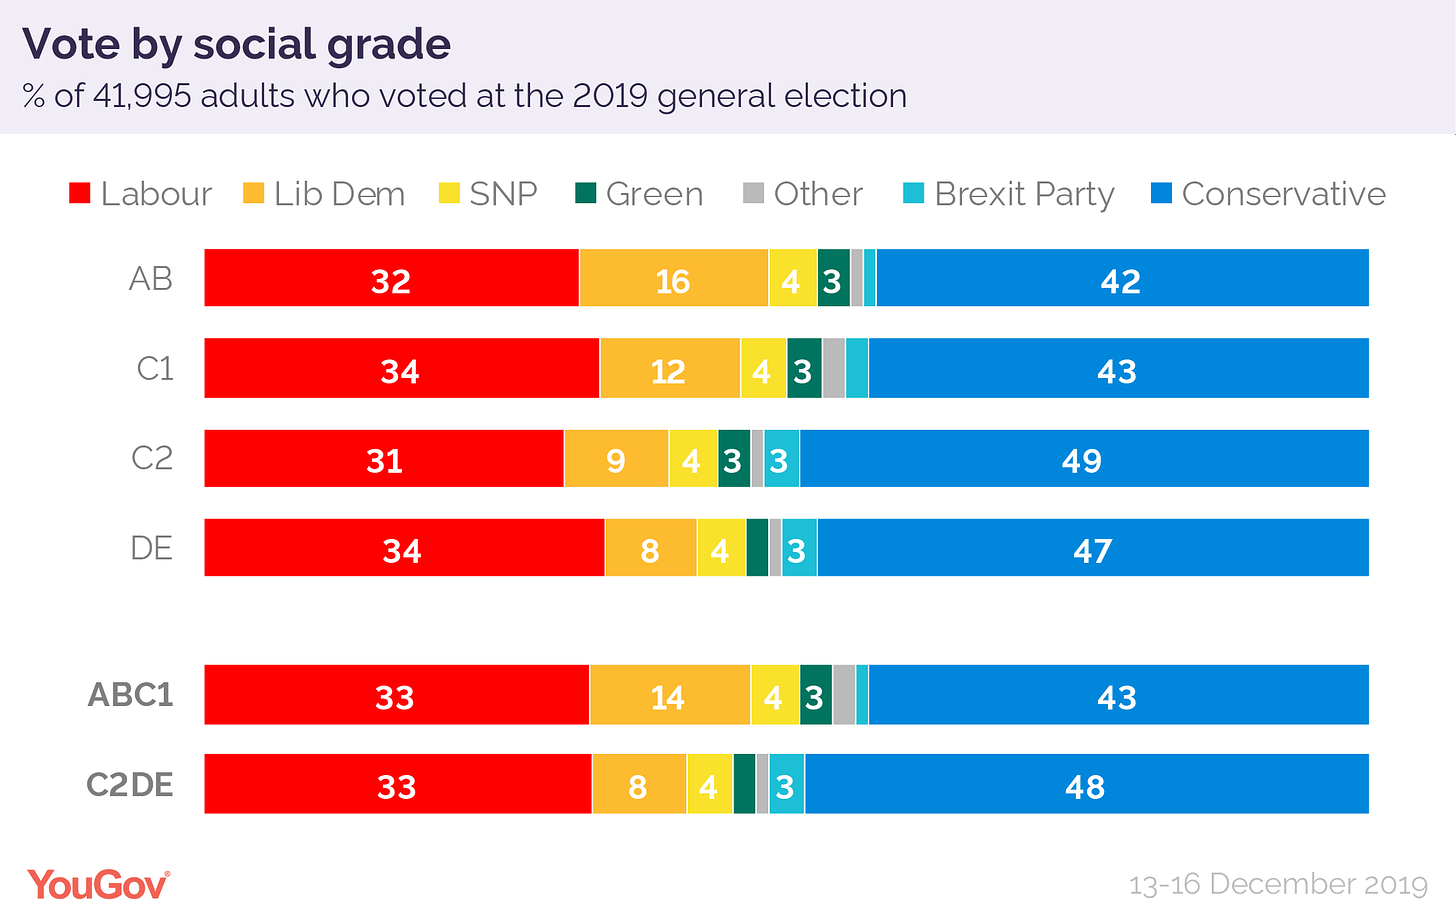
The demographic change in voting patterns has undergone a sort of revolution in recent years with some of the previous vote determinants holding less weight. Class used to be a deciding factor but looking at social grade, there is little variation in voting patterns with there only being a 2% difference in support for Labour amongst the AB and DE social grade with the conservatives seeing a weird staggered support among classes that shows no real correlation between class and party.
Age
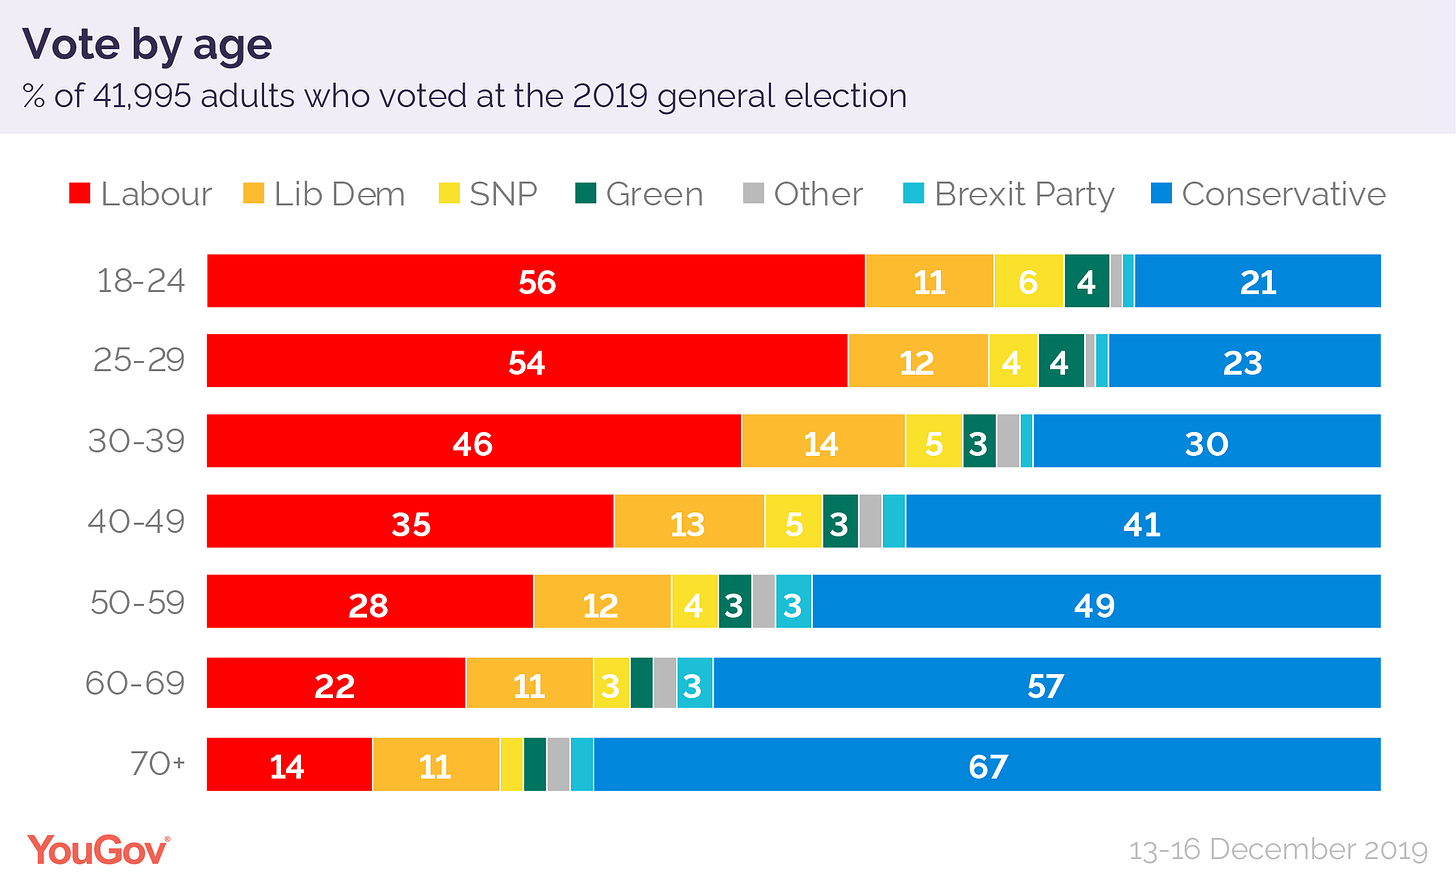
One demographic that has become increasingly important to party allegiance is age. The stereotype that the young are all school indoctrinated Marxist Corbynistas and the old are fossils with stone age belief systems and are more right wing than Mussolini’s right nut may be exaggerated but there is a strong case to be made that it is the greatest determinate of how people vote, especially in recent years. In 2019 the election results by age looked like this:
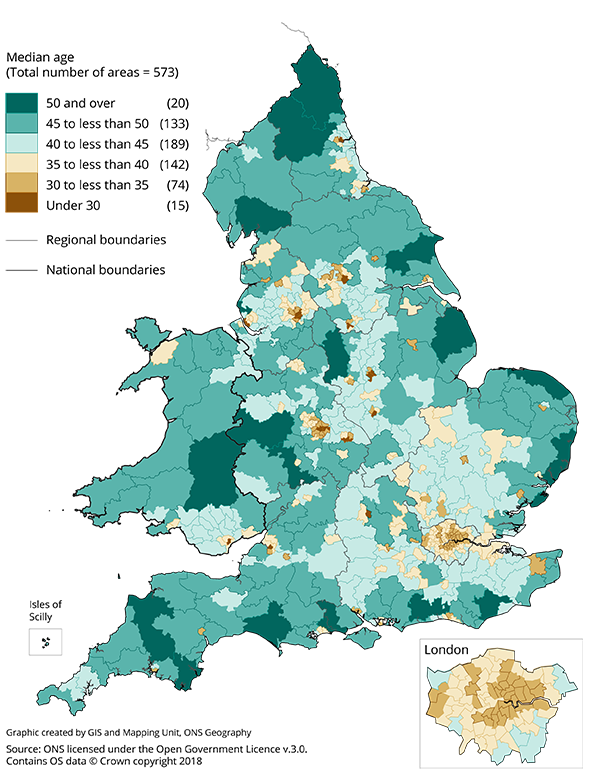
this is especially important for the context of the Blue wall for multiple reasons. The Blue wall has in recent years gained more university towns, especially as immigrant communities move in (who already tend to not vote Conservative), meaning more students are likely to move into these areas, work, study and maybe even settle. This, combined with the different birth rates has resulted in the Blue wall becoming a younger part of the UK when looking at stats.
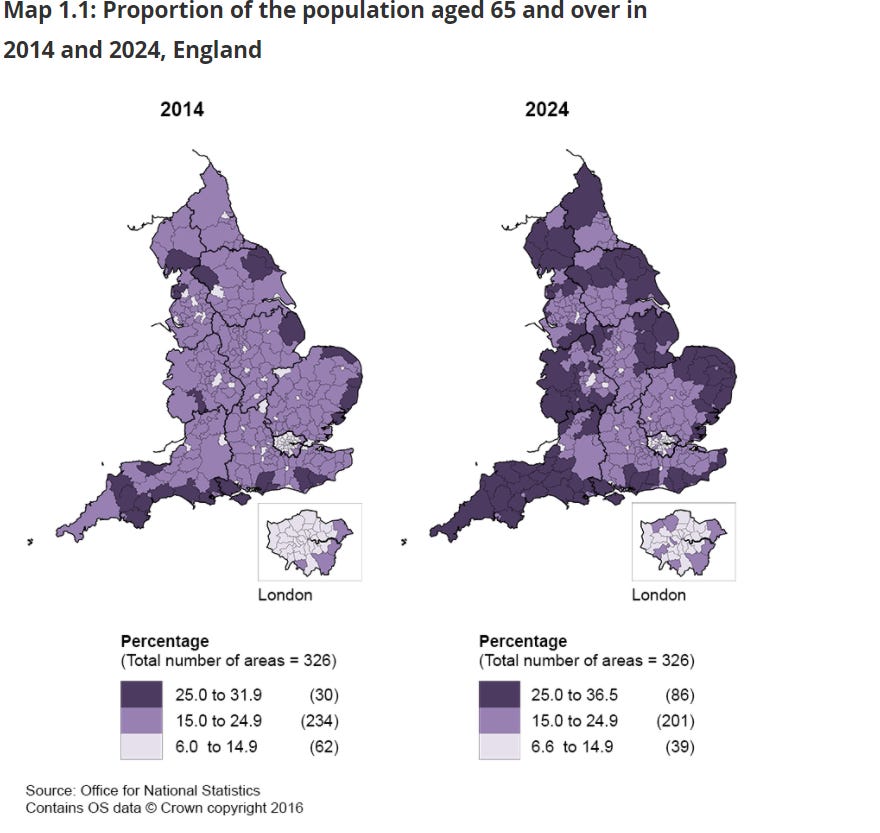
As the population is expected to get older, the Blue wall almost bucks the trend by having similar projected age demographics and is already becoming younger as older voters move out and younger university students and immigrants move in. The trend that the young vote for left wing parties has historically remained, especially in the UK. However the effect of this on voting in the Blue wall is hard to calculate as turnout in the young is still low and although shows some promise of increasing, it will take cultural changes and grassroots organising to get the young to vote. But, if the young begin to vote, it could be a key demographic that the Tories will need to retain the seats, which they show little sign in being able to do.
Education
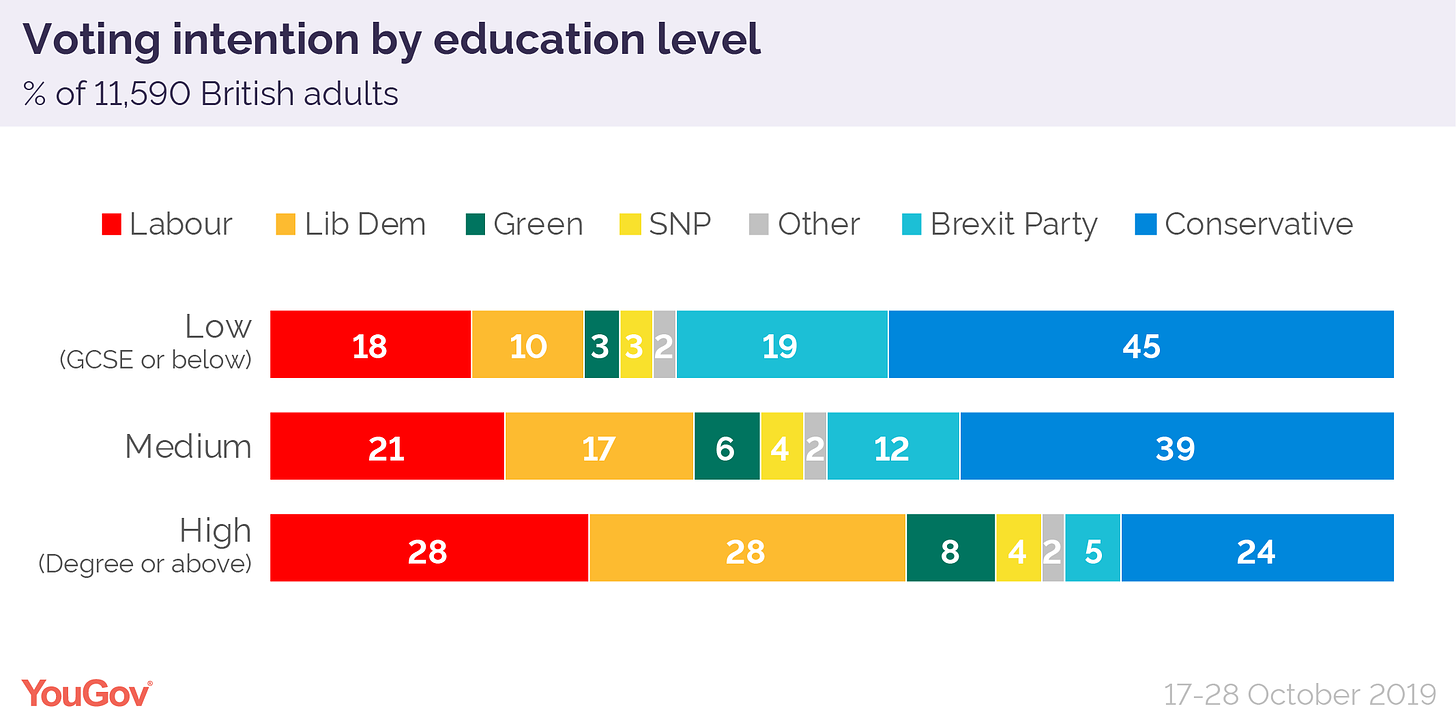
Education has also become a key dividing line in terms of voting behaviour. The theories behind this are mixed, some saying that experience with renting, financial instability, age and or other factories play a role in making the higher educated more likely to be left wing, but whatever the reasons, the link is clearly there.
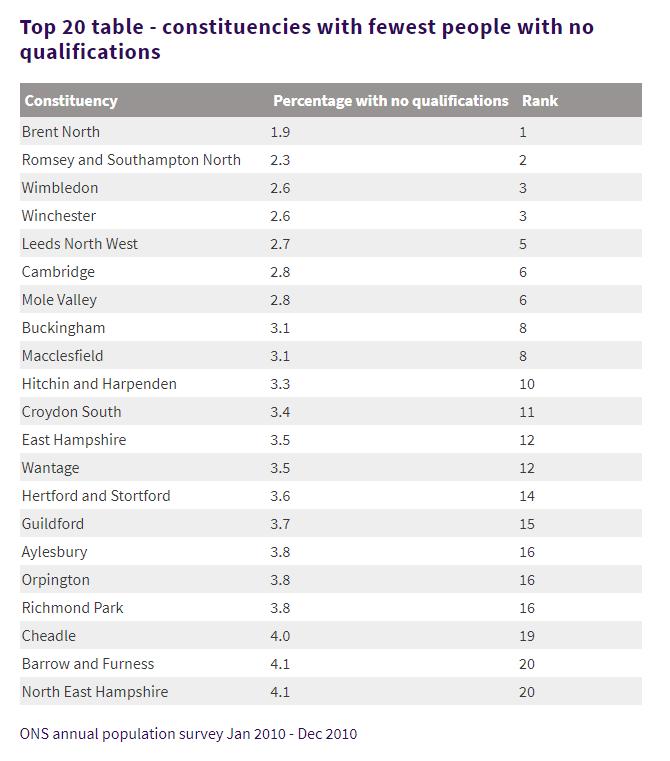
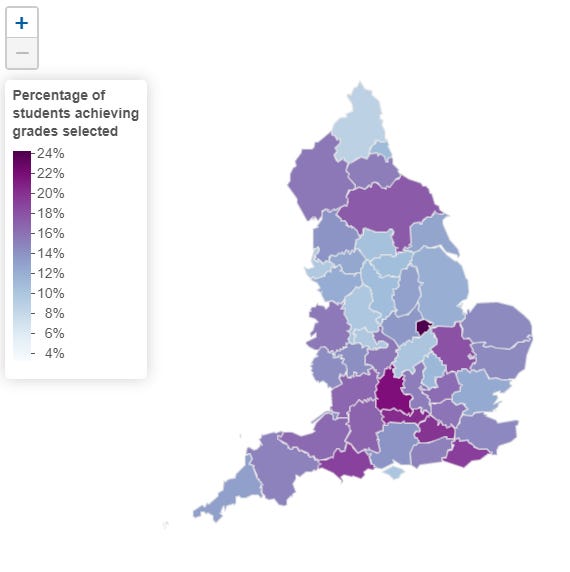
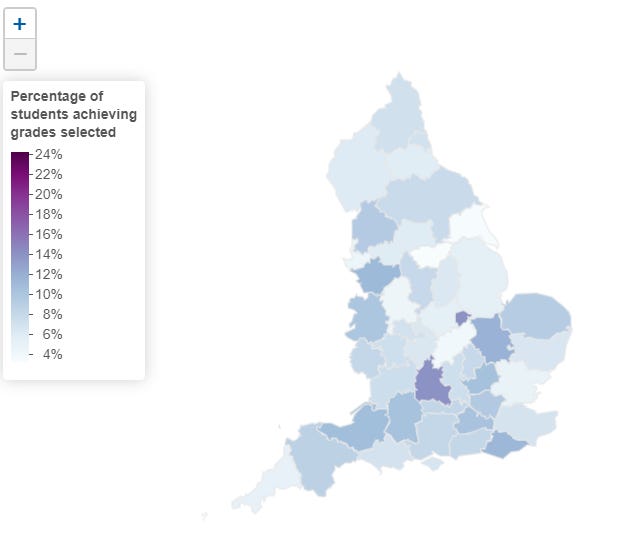
This is of particular importance of the Blue Wall as it is becoming one of the most highly educated areas of the UK. It has some of the highest A level and GCSE results (see here https://analytics.ofqual.gov.uk/apps/Alevel/County )in the country and by extension has some of the best university qualifications.
Worse for the Tories is that this trend shows no sign of stopping as some of the most successful universities and exam results are concentrated in the Blue wall and results for A-Levels improve (maybe that’s why Gavin has been determined to fuck the countries education). If other parties can drive out the university vote this could bring large consequences for the more marginal of the Blue wall seats and further contribute to the electoral demographic shift.
Brexit Realignment
Another and possibly the most crucial factor in the new voter realignment that could hurt the Blue wall is Brexit. We have seen in the red wall and north that the Brexit vote was transferred into right wing parties such as the conservatives and Brexit party, (you can see my previous substack for more on this) but a possible remain vote realignment is also possible and or likely.
The Blue wall was one of the most heavily remain areas in the country. Seeing the tory government embrace leave with open arms, institute a flawed Brexit and whip up nationalistic and illiberal sentiment that has never appealed to these areas could likely turn them away. We have already seen that since the referendum tory vote share in these areas have fallen, even without the Brexit party taking there votes.
Chesham and Amersham saw 55.02% of people vote for remain, compared to 48% nationally and saw a huge swing against the conservatives in favour of the very pro-remain liberal democrats. Remain council areas also saw vote swings against the conservatives in the south East particularly, a very pro remain area.
All evidence suggests, from the recent by-elections, the council elections, the Brexit party vote funnelling to the Tories and polls consistently showing dwindling support for the Tories in their heartlands that the Brexit realignment is very real and could be a major factor in the possible crumbling of the Blue wall.
To early to call?
Although these demographic changes do not go in the Tories favour they alone may not be enough to kick the Tories out of their heartlands. Chesham and Amersham’s shock result was also partly due to local factors and demographic changes take time to set in and becoming key players in elections. There are also a million variables in terms of the future of the pandemic, Brexit, Labour and the Lib-Dems as a party and their platform, the young turning out and the tory party itself and if they continue to embrace the more populist and conservative right wing vision they have been embarking on. But what is undeniable is that the tory party is weaker in these areas then a decade ago and that it shows little sign of stopping.


